HINDSIGHT 80/20 DAILY
One number a day. The same fatigue math that keeps wings on airplanes, running on your own record — entirely on your device. Now with the mission layer: what the spending is for.
Put it on your home screen.
Hindsight Daily is a web app — nothing to download from an app store, nothing that phones home. Installing it just gives it an icon and a full screen.
iPhone / iPad — open the app link in Safari, tap the Share button, then Add to Home Screen.
Android — open the link in Chrome, tap the ⋮ menu, then Add to Home screen (or Install app).
After the first visit it works offline — in a canyon, on a flight, anywhere. Entries wait on the device; nothing needs a connection except the one-time unlock.
In a minute.
Wings don't fail from one terrible moment — they wear out from thousands of ordinary flexes. Engineers add those flexes up with an eighty-year-old method and read one number: how much of the structure's life has been spent.
This app points that method at a person. You give it one number a day — how are you, 0 to 10. Every swing between a good stretch and a hard one is one flex. The math (rainflow counting → Walker correction → S-N life curve → Miner's sum) does the rest, and the surprise it tends to find is the 80/20: the everyday swing, not the catastrophe, spends most of the life.
And since v2.0, the app carries the other half of the sentence: damage units measure what a life costs — missions name what it buys.
New in v2.6.1 — the app folds to fit. Every section collapses to its title — tap any header (the +/− beside the amber light) to expand or fold it. Entry sections start open; the deeper instruments start folded. The app remembers your layout on this device, and it rides in your backups.
Thirty seconds, honestly spent.
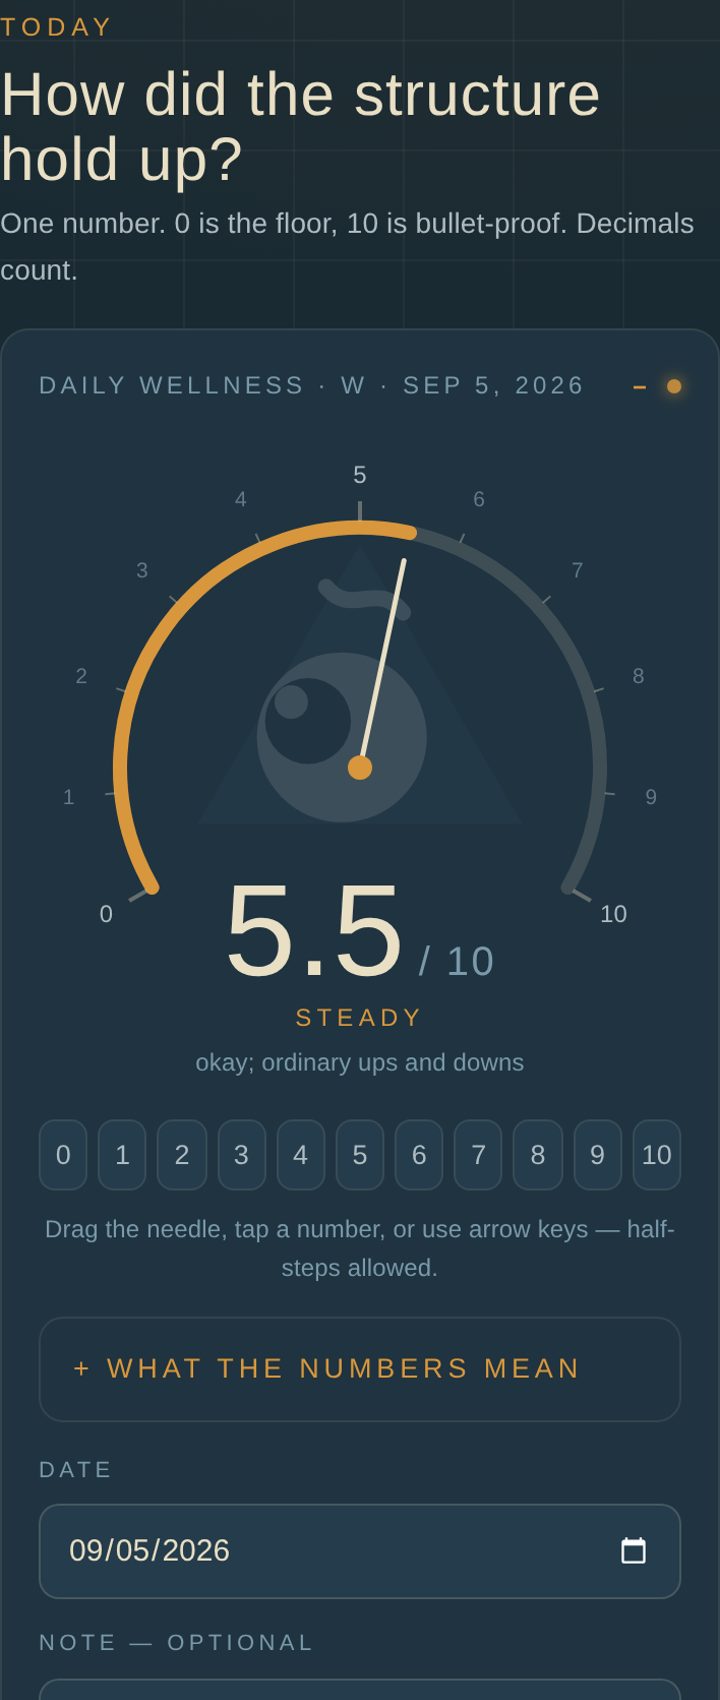
Today is for doing, not reading. Everything that explains lives on Trends.
- 1Set the number. Drag the needle or tap a chip — 0 is the floor, 10 is bullet-proof, half-steps count. Tap What the numbers mean for the scale in plain words. Add a note if you like; it never leaves the device. Save.
- 2Did you build the mission today? One tap: −1 ran against it · 0 didn't engage · +1 built it. A fact about the day — what you did, not how it felt.
- 3A hunch test running? One line says whether today is an ON or OFF day. Tap its button only when reality was different.
Missed a day? Change the date and backfill — the mission chips follow the date. Log more than once a day and the day keeps the average; Replace starts the day over. The record block shows days logged, your latest entry and your middle score. There is no streak: a count that resets to zero is the all-or-nothing trap this app is built to avoid.
Share the record (v4.4.1) — a folded panel under the record block draws a card of your record on your device: The record (days logged, since when, median W, the latest day) or The readout (the Trends gauges — dD/dt, D, bounce-back time (ring-down), where your days settle (set point), the pace phrase), square or LinkedIn-sized, to download, send from the phone’s share sheet, or post with a link. Never the region tile, never the inspection date — those are ground calls, not posts. Nothing from the logbook leaves the device; the email field underneath joins the lab list only if you type an address.
Rate first. Level second.
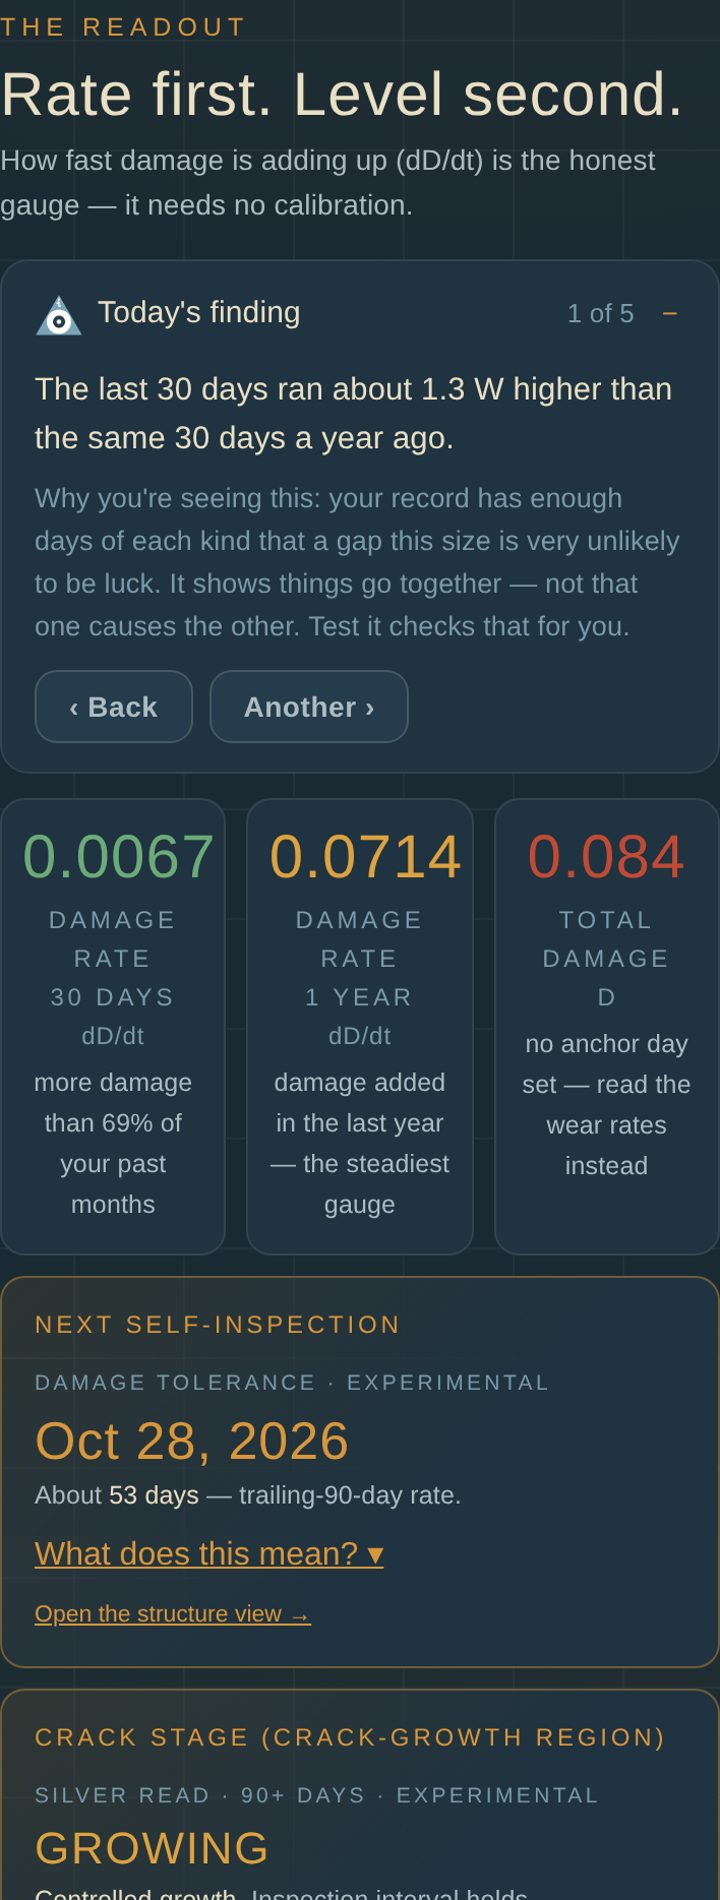
Today's finding leads the tab, and lives only here: one true thing from your record. A pattern ("your Mondays run lower") shows only when your record has enough days of each kind that the gap is very unlikely to be luck — it shows things go together, not that one causes the other. Test it turns it into a hunch test; Back and Another browse them all. Otherwise you get a plain fact from the record.
Damage means the fatigue damage the app adds up from the ups and downs in your W scores. Every snapshot number carries one plain line saying where it sits against your own past:
| Damage rate · 30 days (dD/dt) | How much damage the last month added — e.g. "less damage than 80% of your past months". |
| Damage rate · 1 year (dD/dt) | The steadiest gauge. Appears once your record spans a year. |
| Total damage (D) | The running total. 1.0 = your total on your anchor day (set on the Data tab); without one, read the rates. |
| Next self-inspection | When to look again — never a countdown. |
| Crack stage | EARLY · GROWING · GROWING ▲ · FAST (crack-growth region), from the structure view below. |
| Mission lift · bounce-back check | Do mission days lift your W? How fast do you get back up after a knock? |
Your record in pictures.
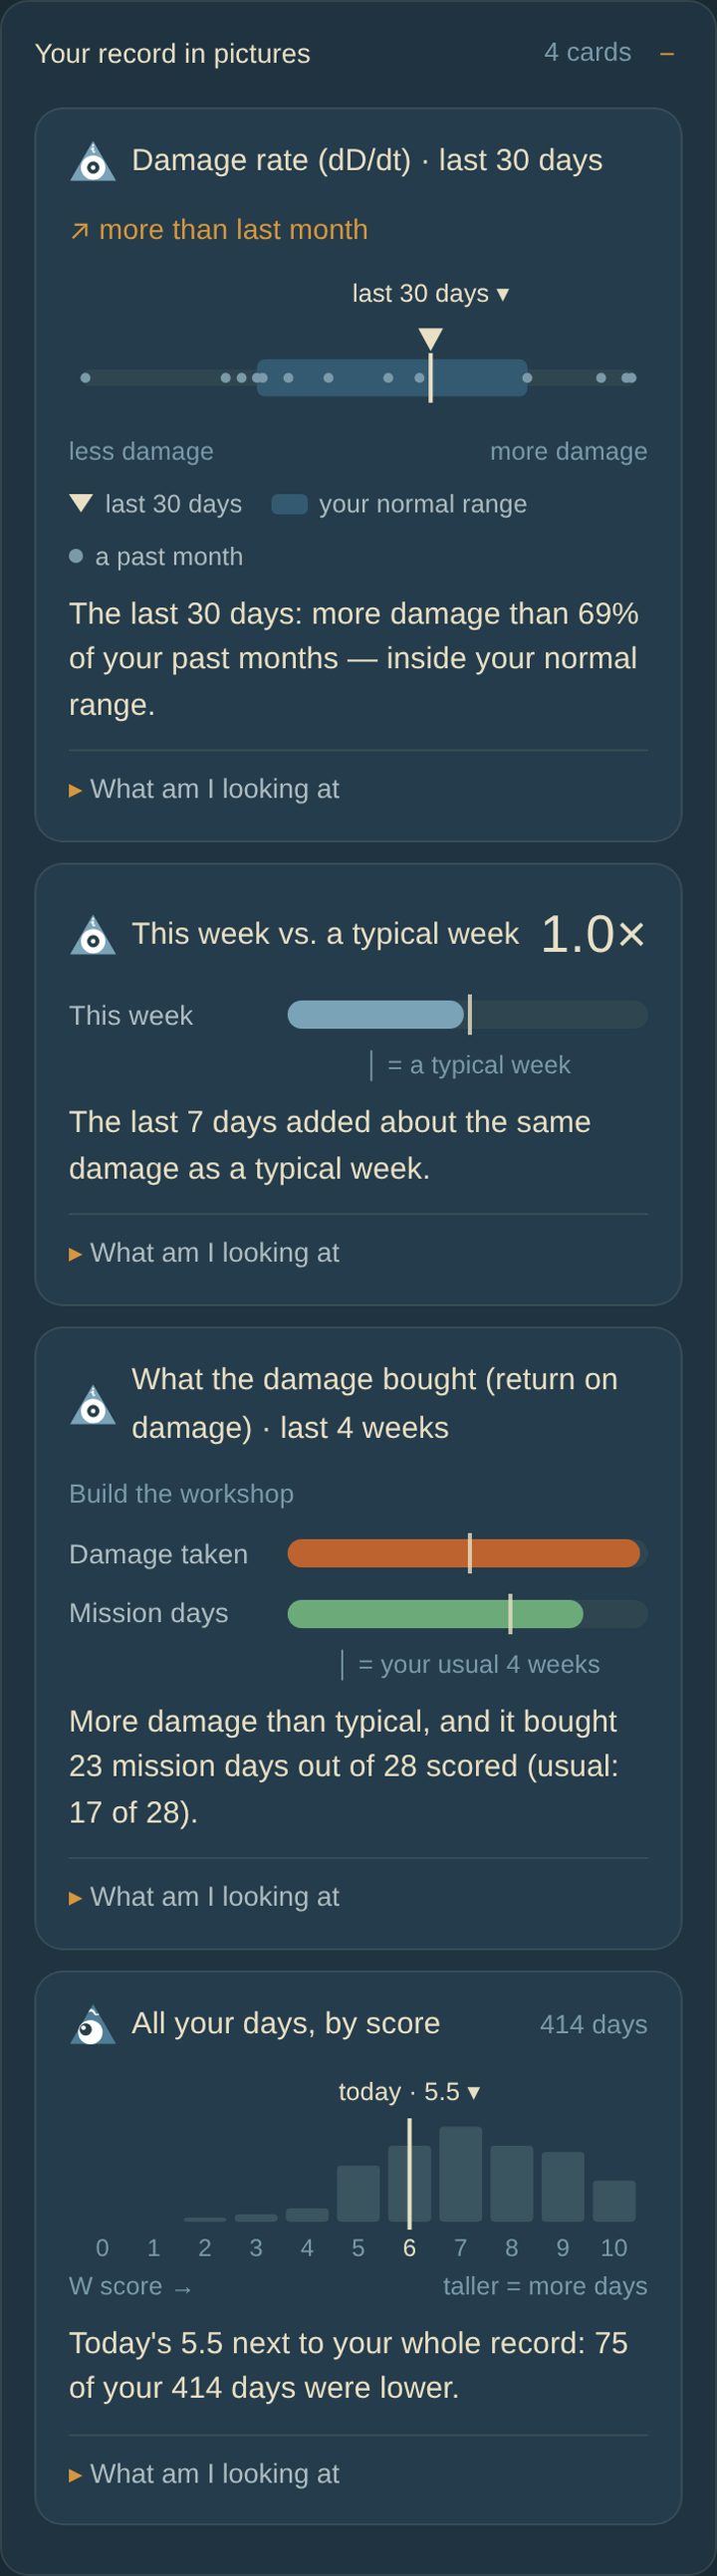
| Damage rate · last 30 days | The last 30 days against your normal range — the shaded block where half of your past months landed. Add your own limit line if you want one; it is off until you set it. |
| This week vs. a typical week | A typical week is your average week over the last 12 months. The bar is this week; the thin line is typical. |
| What the damage bought | Is the damage you are taking bringing more engagement in your mission? Damage taken and mission days, each against your usual 4 weeks. |
| All your days, by score | One column per score, 0 to 10; taller means more days. The line is tonight, seen next to the whole record. |
| The three marks | A small triangle on each card. Eye looking back: straight from what you logged. Eye looking at you: worked out from it. Eye looking ahead: a projection — only if things keep going as they are. |
Further down: your W over any window, a year view, damage over time D(t), and where the damage lives.
The pace alert. Every time you open Trends, the app compares the last 30 days' damage rate with your usual pace. Running hot (2× your usual pace or more): the last month is adding damage faster than usual — open the Report, protect the recovery days, and if it stays hot a few more weeks, say it out loud to someone you trust. Easing (≤0.5×): whatever changed is working. In between, the app stays quiet — steady flight needs no callout.
Your W over time (flight profile). At the top of Trends the app reads your last 90 days like a usage spectrum and names the profile — Fighter, Sailplane, Transport, Aerobatic, Trainer, Rescue, Test bed or Depot (or "ferry flight" when it's too quiet to call) — then says where that spectrum sits for your Mind My Material family on the MmM Flight Test: Its best mission · Its second best · Not its mission (not a failing — just the wrong fit) · or, for Test bed and Depot, A place, not a mission. An opt-in toggle can even feed your material's own fatigue constants into the damage model.
What the spending buys.
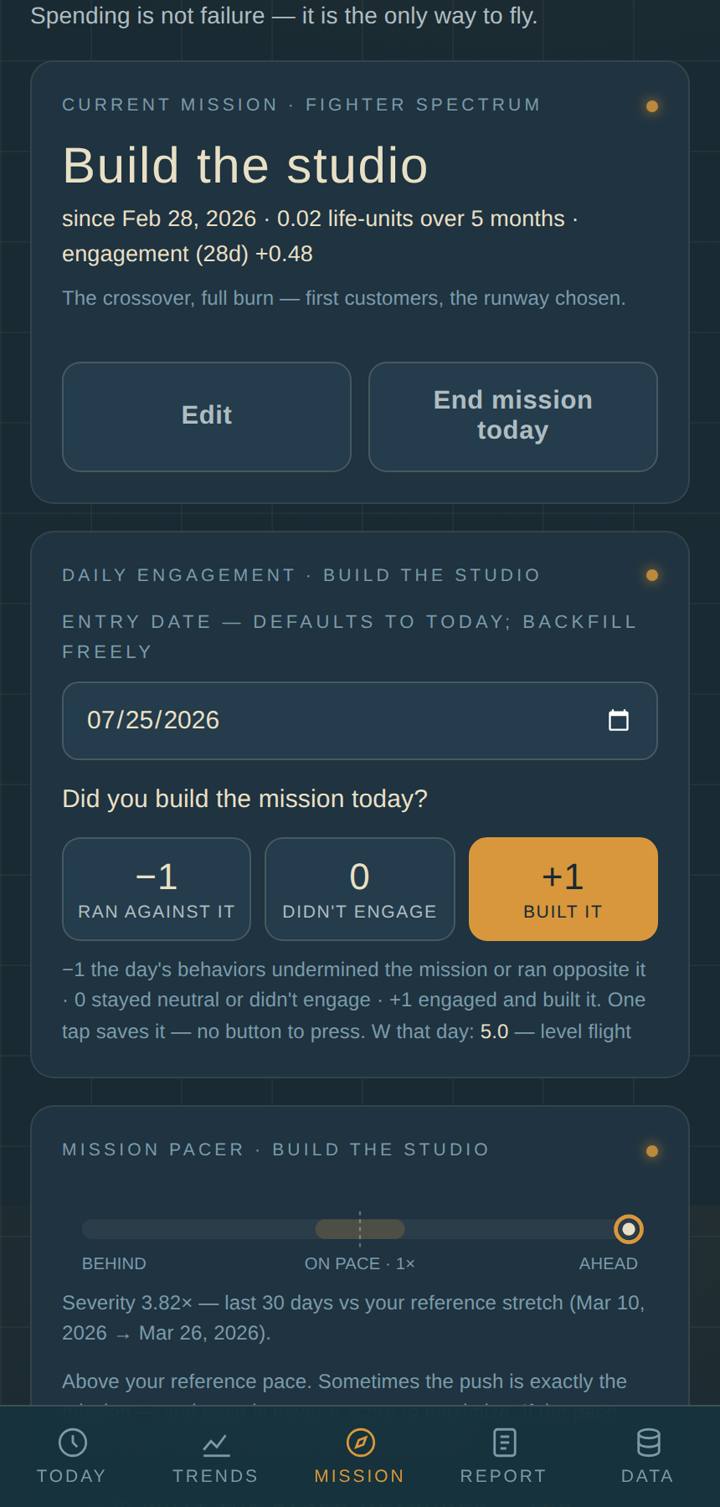
D measures spending; the Mission tab names what the spending is for — the ASIP Task I move — 𝑖 SIP i5.1.2, deciding what the airframe is built to do.
- 1Start a mission in three taps. Pick a spectrum — Fighter, Sailplane, Transport, Aerobatic, Trainer, Rescue, Test bed, Depot (✦ marks your Mind My Material family's best and second-best missions on the MmM Flight Test) — name it in your own words, Start.
- 2Dates live under an Advanced fold. Start defaults to today; an end date is only for logging past missions — so a whole life's record can be mapped from journals, retroactively.
- 3Then, each day: one chip. "Did you build the mission today?" — −1 ran against it · 0 didn't engage · +1 built it. One tap saves it. The chips have their own date field, so backfilling engagement works like backfilling W.
One mission at a time; gaps between missions are allowed and never counted against you — ground time is preparation for engagement.
The service log, and the alignment map.
The service log lays your declared missions under the D(t) curve as amber bands — Mission 3 — 0.31 life-units over 2.1 years — a service log, not a diary. Every mission flown stays reviewable; sometimes the hangar was exactly the right call, and the log should say so without apology.
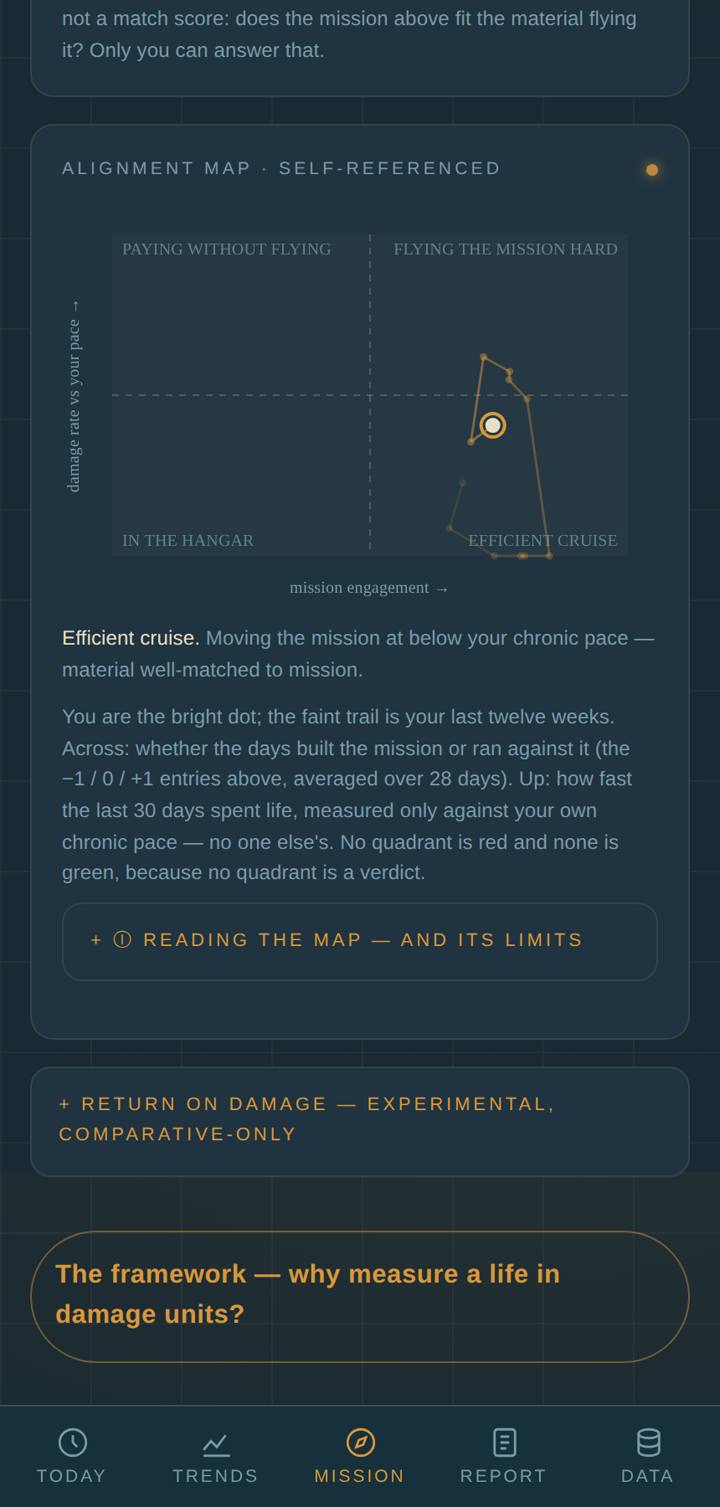
The alignment map is a 2×2, measured only against yourself. Across: 28-day mission engagement (the chips). Up: 30-day damage rate against your own chronic pace. You are the bright dot; the faint trail is your last twelve weeks.
Each week earns its trail point once it has three daily chips in its trailing 28 days — so a young record shows one dot, and the caption counts "Trail: n of 12 weeks" until the trail is full. Backfill chips from a journal and it fills in immediately.
No quadrant is red and none is green, because no quadrant is a verdict — and the tab stays silent when your last two weeks have been heavy.
The pacer, and what the damage bought (return on damage).
The mission pacer. Edit a mission and mark a reference stretch — a spell when you were flying it well — and a pace strip appears on the current mission: your last month's damage rate against your own reference rate, behind / on pace / ahead.
Mismatch is the signal in both directions: above-pace on a Depot or Sailplane refit is the alarm ("the refit is running hot"); below-pace on a build mission means it isn't being flown. Pace is never a score to maximize, and the target only ever comes from your own record — never a lookup table.
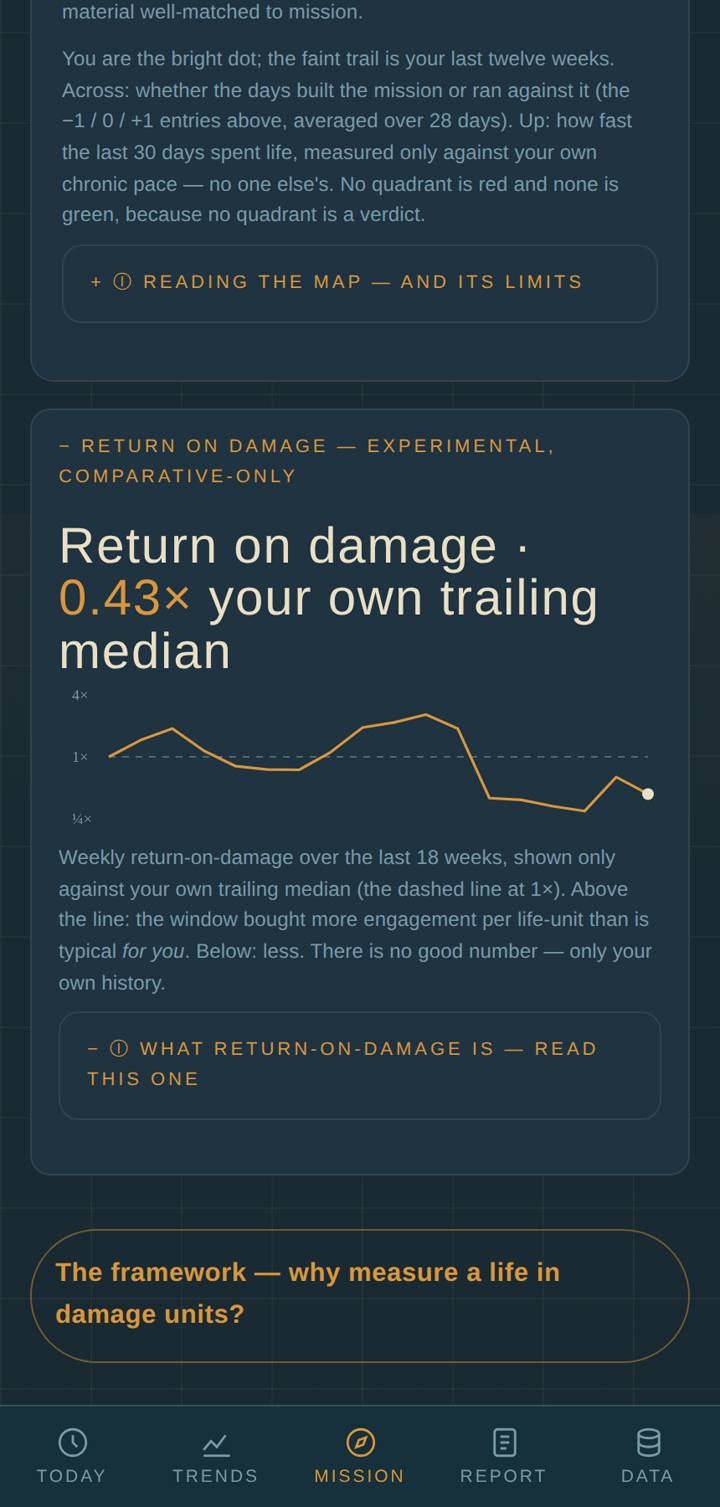
What the damage bought (Return on damage) (experimental) folds at the bottom of the tab and starts reading within days of your first chips: engagement bought per life-unit spent over a trailing 28-day window, shown only against your own trailing median. There is no good number — only your own history.
Not all damage is spending. Illness, loss, and weather accrue on every airframe. What the damage bought (Return-on-damage) is a lens for chosen missions — never a judgment on what happened to you.
Mission lift — the natural-frequency check.
The instrument's third leg. D measures what the flying costs; the −1 / 0 / +1 chips measure whether the mission moved; mission lift asks the question neither can: does flying this mission feed the airframe? On the days you tapped +1, did W run above or below your own baseline?
The headline is a mean ΔW — always shown with an approximate ± band, never a bare number — and beneath it the mission lift response: your average W distance from baseline at each day around a built-it day, three days either side. The bars before day 0 are the honest direction check: if W is already up before you engage, the record reads "you fly when well" at least as much as "flying makes you well," and the caption says which side your record favors.
Three reads, and the band must clear zero before the copy commits to any of them: Resonating — the mission and your material appear to be answering each other. Reading level — no clear response either way yet. Holding on too tight? — engagement running against your own wellness. That last one is a question by design: some missions are worth what they cost, and only the pilot prices that. It follows the mission selector, so past missions replay their mission lift too — sometimes the review says the expensive mission was feeding you all along.
Not all damage is spending. Illness, loss, and weather accrue on every airframe. Mission lift is a lens for chosen missions — never a judgment on what happened to you, and never a verdict on whether a mission is worth its cost. It adds no new inputs and no new storage: it only reads what the dial and the chips already hold.
Notice the stretch. Name the break. See if it worked.
An aircraft does not wait for the calendar when its g-meter shows overloads. The overloads are counted, enough of them call an inspection, the work is done in the depot, and the aircraft is timed back into service. Version 5.0 gives your record the same loop, in three gauges. All three read the one number you already log — there is nothing new to enter.
| The problem | Hard days stack up, and most of us only notice a bad stretch once we are deep in it. Inside one, it feels like it will never end; afterwards, there is no way to tell whether the break we took helped. |
| What the loop does | Counts hard days for you and says so early · shows which day of the week costs you most · times how long your dips last, and marks the ones where you held a planned break. |
| Automatic | All three gauges. They are computed from your nightly number. |
| Optional | The heads-up (can be switched off), the planned break (depot block) it offers, and the soft-Monday test. |
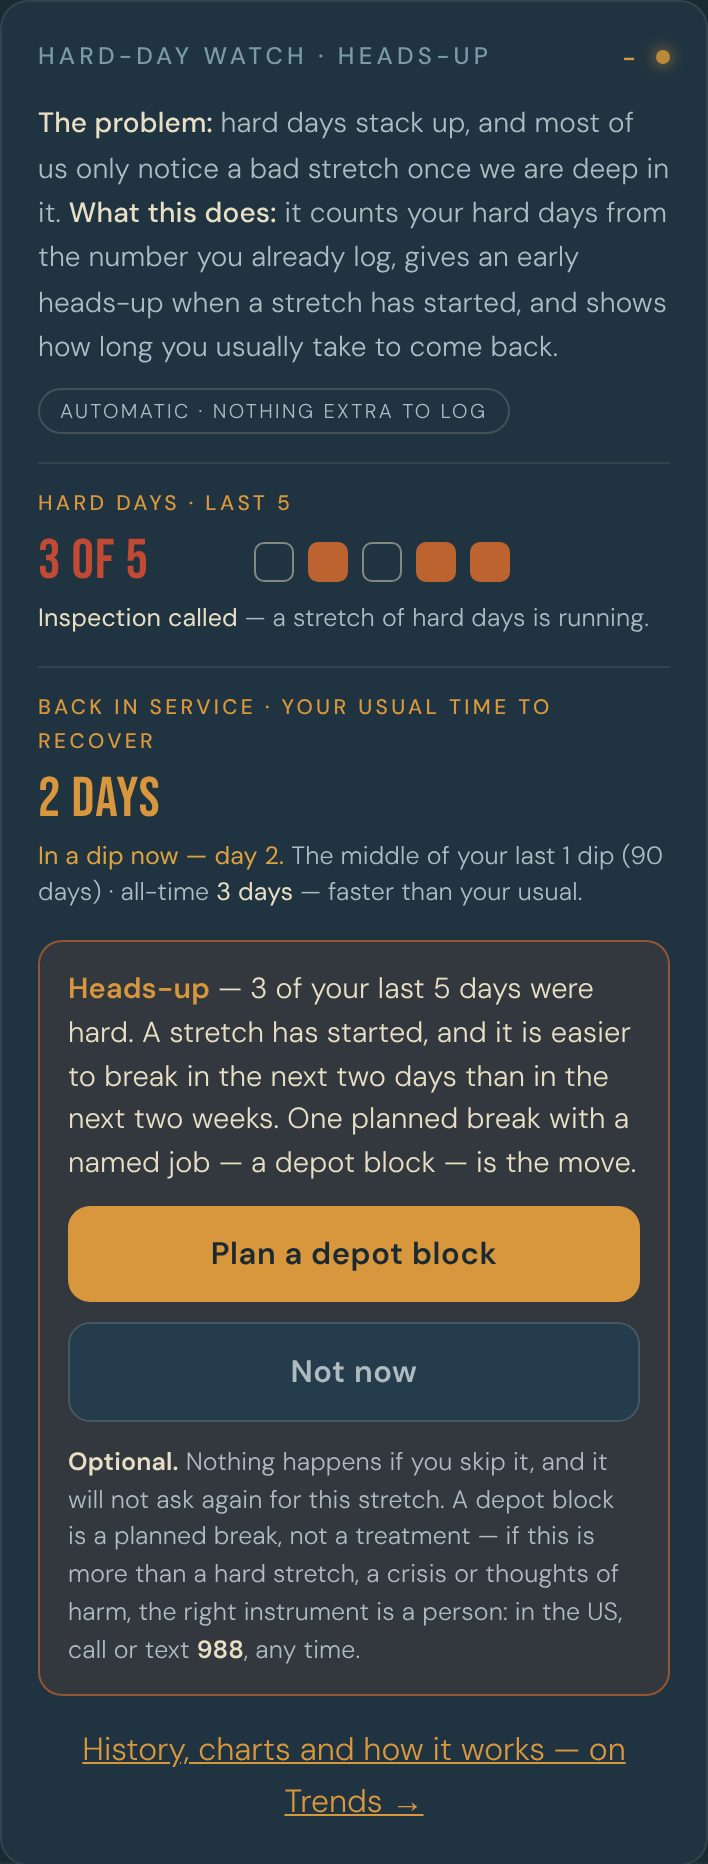
Hard-day watch — the summary, on Today. A folding panel under the Save button. Hard days · last 5 shows how many of your last five logged days were W 4 or below, with five squares (filled = hard): Clear, Watch (one short of a trip) or Inspection called (3 of 5). If today isn't logged yet, it reads through yesterday and says so; if one of the five days is missing, it shows “—” instead of guessing. Recovery time after a hard stretch (Back in service) is your usual number of days from a hard day back to your typical level.
The heads-up and the planned break (depot block). At 3 of 5 the panel raises one heads-up: a stretch has started, and it is easier to break in the next two days than in the next two weeks. It offers a planned break (depot block) — a planned break with a named job (𝑖SIP i5.5.11, Repairs). Pick the day, the length and the job, from your Repair Bay lists or in your own words; a calendar file is optional. Or tap Not now. Either answer is logged once and it never asks again for that stretch. Once the day has passed, the block is counted as held unless you tap It didn't happen — there is no nightly question.
Why name a job? In the founder's record, time off by itself did not shorten recovery. A day off is a parked aircraft, not a repair. A named job is something the record can test.
Are hard days stacking up?
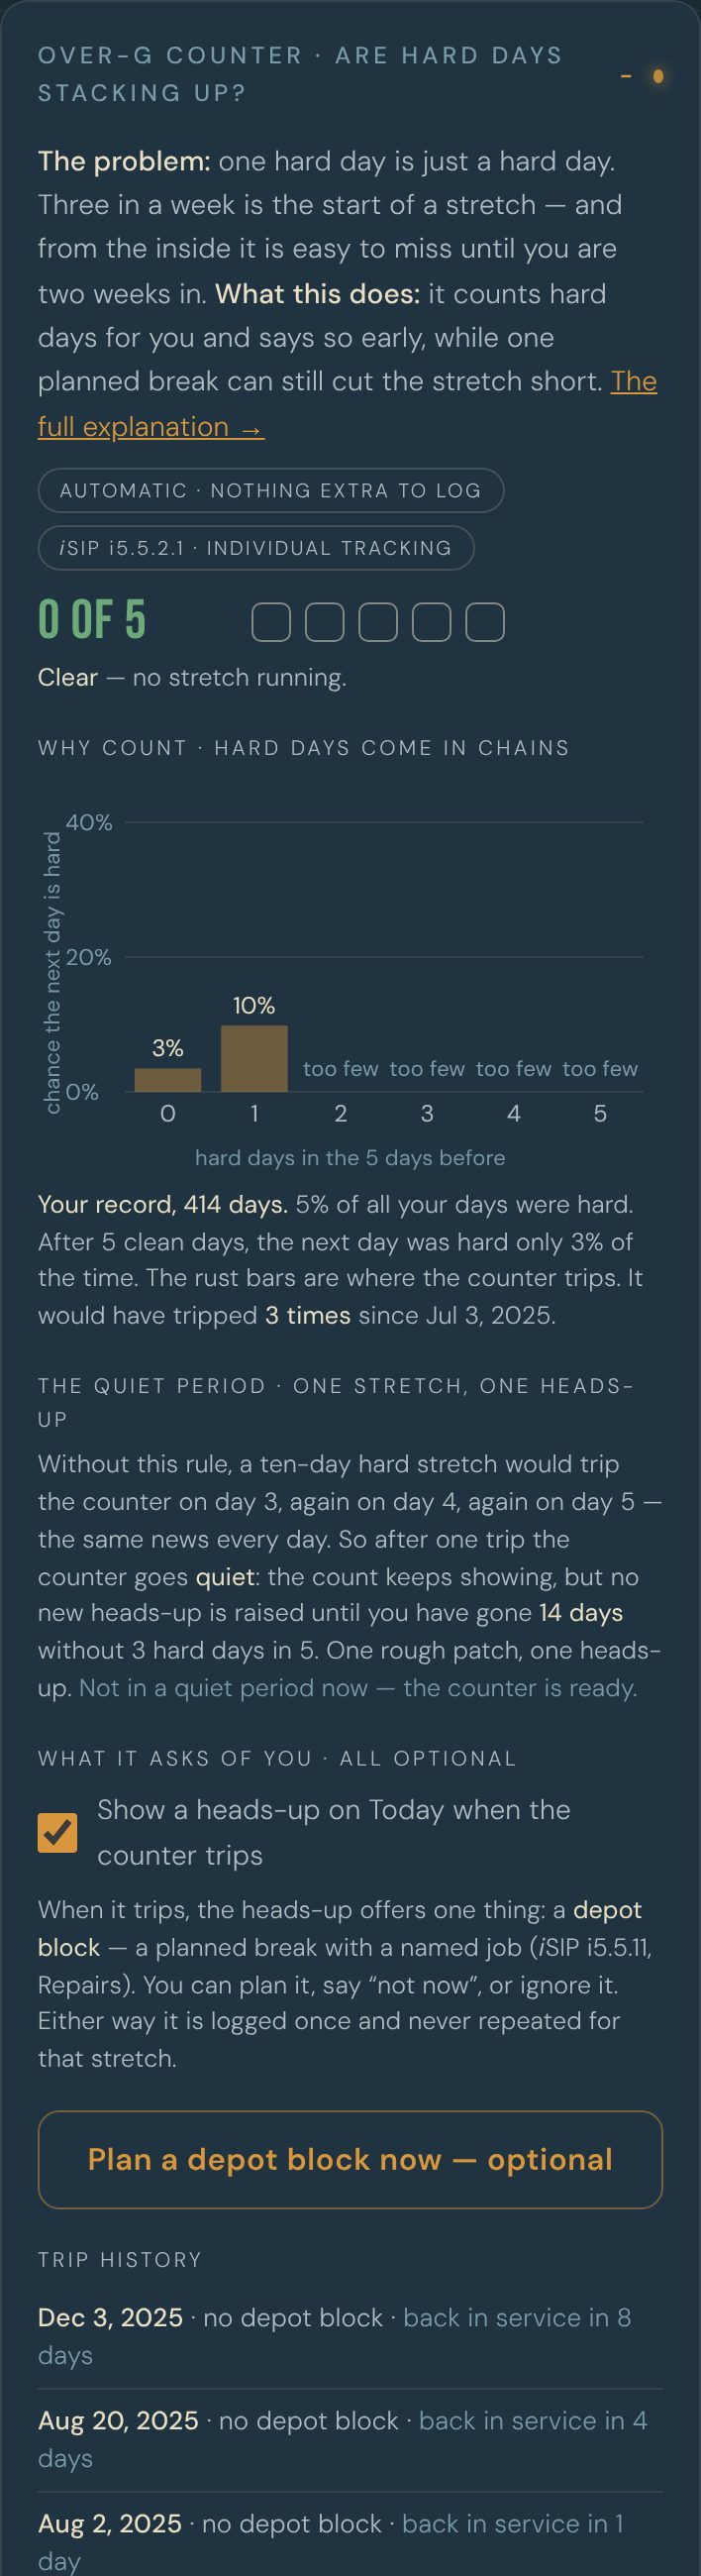
The details behind the summary. The chart shows how often the next day was hard after 0, 1, 2 … 5 hard days in the five before it. In the founder's 2,494-night record, 27% of all days were hard — but after five clean days only 11% of the next days were; after 3 hard in 5, 43%; after five in a row, 66%. Hard days come in chains, which is why counting them works. Your own numbers replace the reference once your record reaches about 200 days.
The quiet period. Think of a smoke alarm you have already acknowledged: it does not need to keep sounding for the same smoke. Without this rule, a ten-day hard stretch would trip the counter on day 3, again on day 4, again on day 5 — the same news every day. So after one trip the counter goes quiet: the count keeps showing, but no new heads-up is raised until 14 days have passed without 3 hard days in 5. One rough patch, one heads-up.
Below that: a switch for the heads-up, a button to plan a planned break (depot block) at any time, and the trip history — every trip, what you did about it, and how long that dip took to clear.
Which day costs you most?
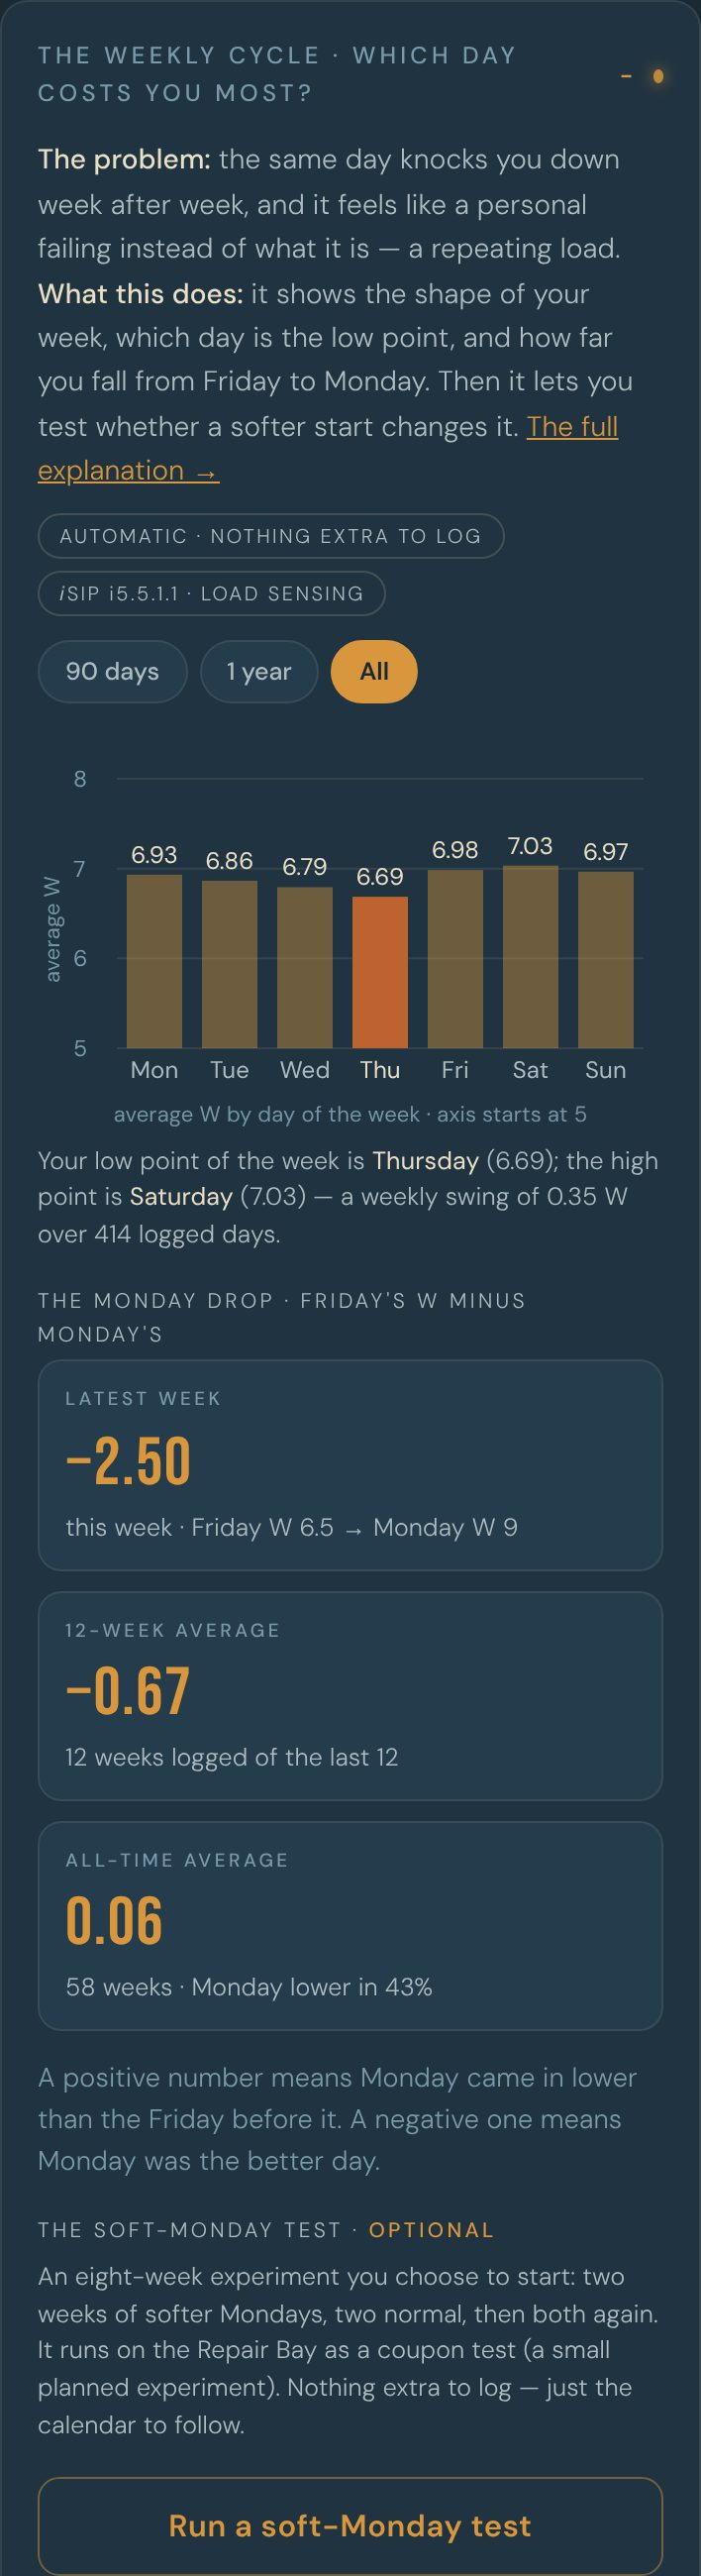
In aircraft work the ground-air-ground cycle — sit on the ground, fly, sit on the ground again — is often the most wearing cycle an airframe sees, because it runs through the whole load range once per flight. A week can do the same to a person. The bars are your average W on each day of the week, over 90 days, a year or the whole record; the darkest bar is your low point, whichever day that is.
The Monday drop is Friday's W minus the following Monday's, for every week you logged both: the latest week, the last twelve, and all time. In the founder's record Monday averaged 5.41 against Friday's 6.57, and Monday was the lower day in every year from 2020 to 2026.
Run a soft-Monday test (optional) declares an eight-week hunch test (coupon test) on the Repair Bay: two weeks of softer Mondays, two normal, then both again. You say what “soft” means — a lighter first block, or a Sunday-evening plan for the week — and what result would make you drop it. If your week doesn't run Monday to Friday, read the bars and ignore the drop.
How long do dips last?
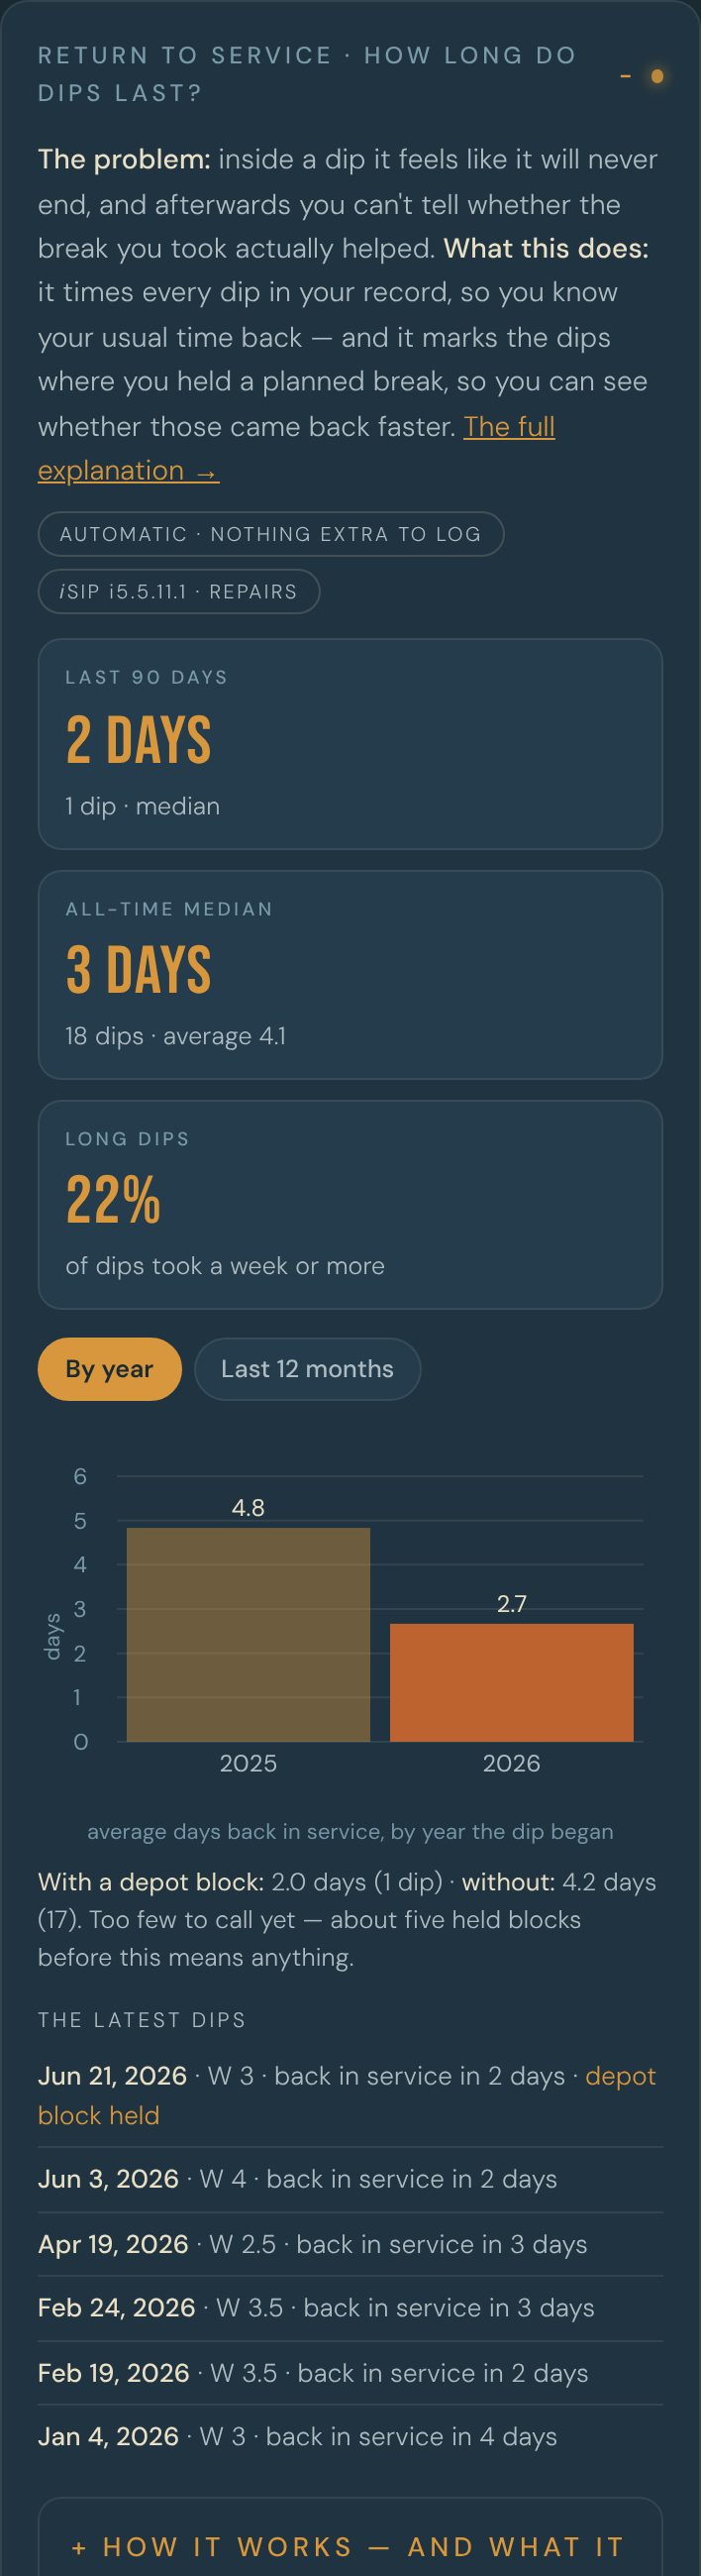
A dip starts on the first hard day after a day that wasn't hard. Recovery time after a hard stretch (Return to service) is the number of days until W is back at your typical value — the middle value of your record. The panel shows the last 90 days against all time, the share of dips that took a week or more, and the trend by year or by month. A dip that runs into an unlogged day is not timed, so a gap can never flatter the number. It needs 30 logged days.
Not the same as the Bounce-back check (Modal Survey)'s bounce-back time (ring-down). Bounce-back time (Ring-down) is a fitted estimate of how fast an ordinary knock fades, read from every pair of days. Recovery time after a hard stretch (Return to service) is counted, not fitted: real hard days, and the real days until you were all the way back. Bounce-back time (Ring-down) describes the spring; this times the actual recoveries — and it is the one a planned break (depot block) can be scored against.
That scoring is the point: the panel compares dips where you held a planned break (depot block) with dips where you didn't. It says “too few to call” until about five held blocks, and even then it is an association in your own record, not proof.
Limits, said plainly. The thresholds — W 4, 3 in 5, 14 days, your median — were picked by looking at one record, so they are starting settings: change them under Data → Maintenance loop — settings. The gauges describe your own past days and offer a planned break. They do not diagnose and they do not predict illness; a trip does not mean something is wrong with you. Crisis or thoughts of harm: in the US, call or text 988. The full account, with the record behind it: isightlabs.netlify.app/maintenance_loop
A second opinion from fracture mechanics.
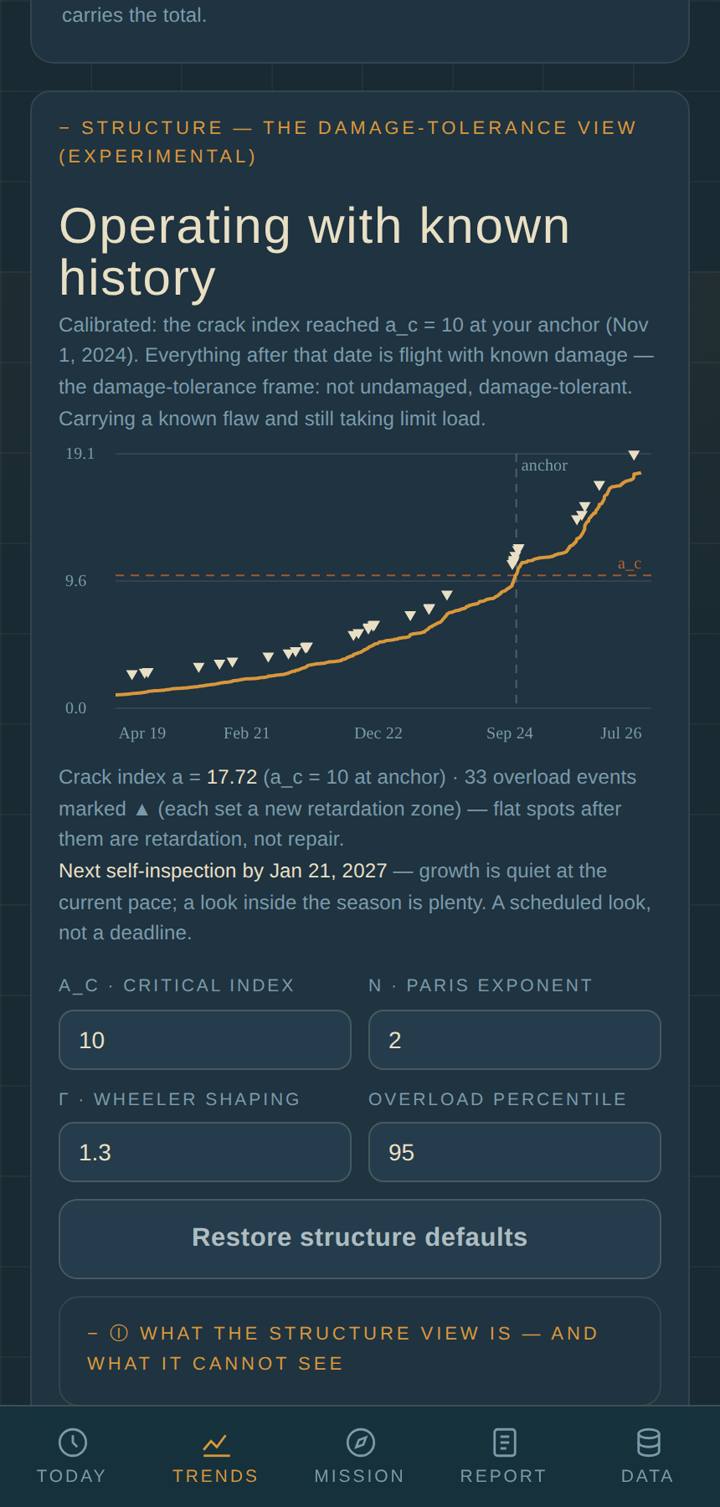
A fold at the bottom of Trends — folded to its title like every section since v2.6.1; tap to expand — runs a second life-model on the same days: a crack index a(t), grown cycle-by-cycle in time order (Paris' law with Wheeler retardation). Where the damage sum is sequence-blind, this track is sequence-dependent by construction — the same days in a different order give a different answer.
Hard stretches — your own worst 5% of swings, marked ▲ — temporarily slow the growth that follows. Retardation, not repair: nothing heals. A hard event changes how the ordinary cycles after it bite, for a finite while.
Set your anchor and the curve calibrates; everything after that date reads "Operating with known history" — the damage-tolerance frame: not undamaged, damage-tolerant.
"Next self-inspection by [date]" is the app's only forward-looking line, and it is maintenance language — when to look inside, the way airframes get scheduled inspections. Never a countdown: spent is knowable; remaining is not, and neither track ever shows remaining life.
How fast do you get back up?
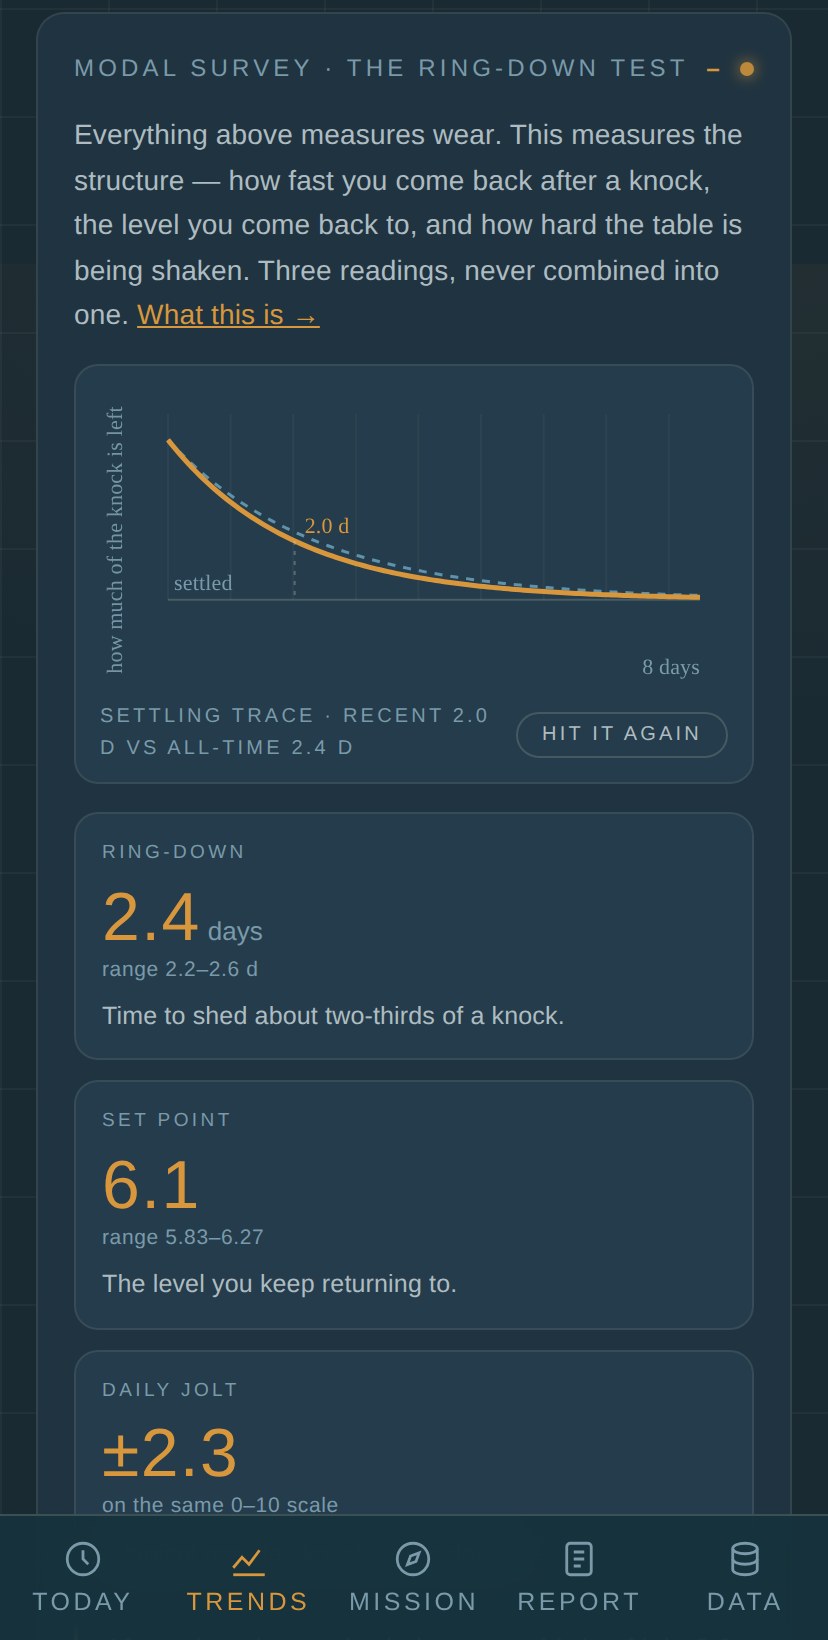
Every other panel on Trends measures wear — damage piling up on a structure whose properties are taken as given. This one measures the structure. The damage and crack tracks are 𝑖SIP Task V, force management; the Bounce-back check (Modal Survey) is i5.3.2.1, Task III — the ground vibration test, where engineers thump a finished airframe and time how long it rings.
Think of a marble in a bowl. Something knocks it up the side; the bowl pulls it back. Three separate things govern that, and the panel keeps them as three separate readings, never averaged into one:
| Bounce-back time (Ring-down) | The days it takes to shed about two-thirds of a knock — how steep the bowl is. Your recovery speed. |
| Where your days settle (Set point) | Where the bottom of the bowl sits: the level you return to, whatever today happened to be. |
| Daily swing (Daily jolt) | How hard the table is being shaken — the size of a typical one-day swing. |
Each prints with a range, because a bare number would claim a precision the record hasn't got. The ranges come from resampling your own day-pairs, and they are seeded from the record itself, so the same record always prints the same range.
The second analogy is the design choice, and it is the one that explains why a slow bounce-back time (ring-down) isn't simply "worse". A trainer is built stable — let go of the stick and it finds level on its own, predictably, slowly. A modern fighter is built with relaxed stability on purpose: the centre of gravity is moved aft until the airframe barely holds its own attitude, which is exactly what makes it quick, and it needs a flight control system correcting it many times a second to stay flyable. Neither is the better aircraft — they are different answers to different missions. A short bounce-back time (ring-down) is the trainer's virtue; a bounce-back time held short by effort is the fighter's, and it is worth knowing which one you are reading.
Below the gauges, the rolling survey shows how the bounce-back time (ring-down) and where your days settle (set point) have moved. Each point reads the 180 days centred on it, so the line lags real change by about three months — read the shape, not the day. The survey by mission fold runs the same fit inside each declared mission's own dates; short missions give wide ranges, and two numbers only differ meaningfully when their ranges don't overlap.
A short bounce-back time (ring-down) means you recover fast. It does not mean you are doing well. Read it beside where your days settle (set point) — a steep bowl can sit at a low level. And quiet and braced are opposite readings, not the same one: quiet is a small jolt; braced is a big jolt with a short bounce-back time (ring-down).
It is not an early-warning alarm. Run against the worst event in the founder's own record, the bounce-back time (ring-down) was improving right up to that morning. The instrument saw nothing coming, and we would rather say so than oversell it. It is a condition check — what shape the structure is in — not a prediction, not a diagnosis, and one person's evidence so far. The full explanation, with both analogies and the six-year chart: Bounce-back check (Modal Survey) →
What actually works on you?
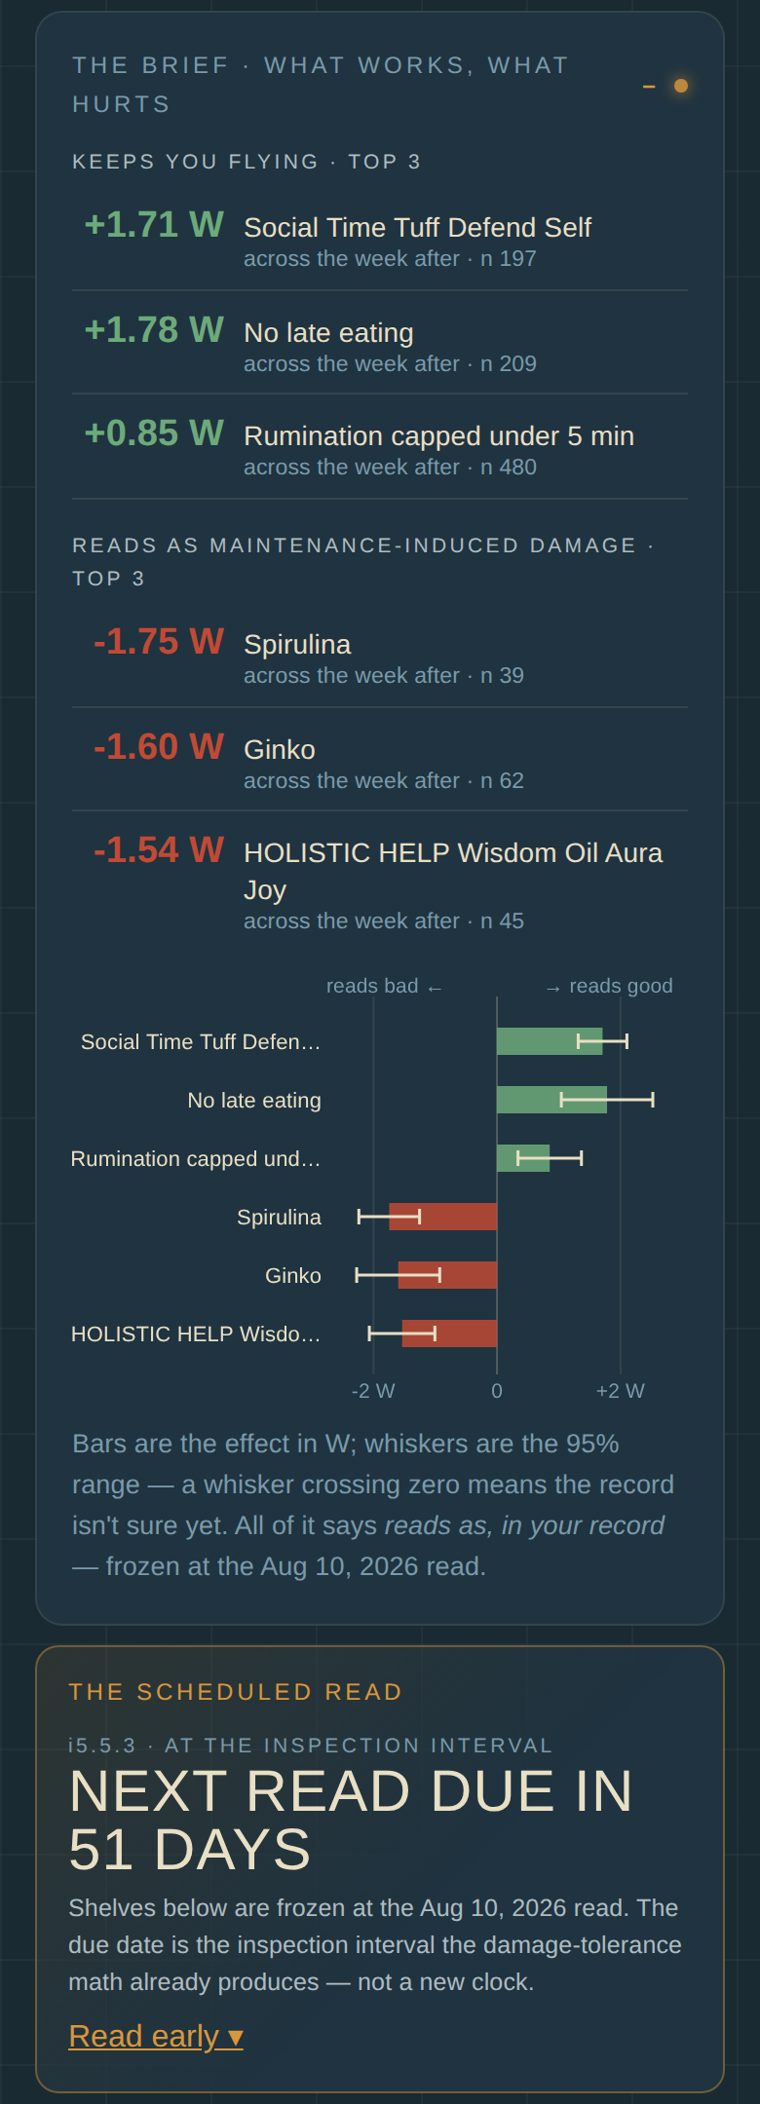
Every other tab keeps the flight log — where you went, what it cost. The Repair Bay keeps the maintenance record: which recovery procedures actually hold on you, and which well-meant ones read as maintenance-induced damage (mechanics call it hangar rash — the dents the maintenance itself puts in). The added burden is one tag on repairs you already log: what it was, its dose, and whether you did it to recover.
| The Brief | First thing on the tab: your top three that read good, your top three reading as MID, and the effect ladder — signed bars in W with 95% whiskers. A whisker crossing zero means the record isn't sure yet. |
| Works for you (Certified) · 3 slots | Dose stated, interval stated, a positive read, and a survived hunch test (coupon test). Your working repair manual. |
| Doesn't work for you (Grounded) · 3 slots | Done to recover, reads negative. Both halves required — a vice reading badly is not news; a remedy reading badly is. |
| Still testing (In Test) · 5 slots | Candidates, ranked, waiting on evidence. A full list always asks who gets displaced; everything ever tried keeps its verdict in the Service History archive. |
The engine scores surprise, not mood: it subtracts what yesterday alone would predict (the Bounce-back check (Modal Survey)'s bounce-back time (ring-down) model) and compares only against days from the same era of your record — so neither momentum nor a hard year can masquerade as the procedure. Verdicts wait for five occurrences and print in plain words: reads good or reads bad, on the days you did it, the day after, or across the week after.
Hunch tests (coupon tests) — redesigned in v6.0
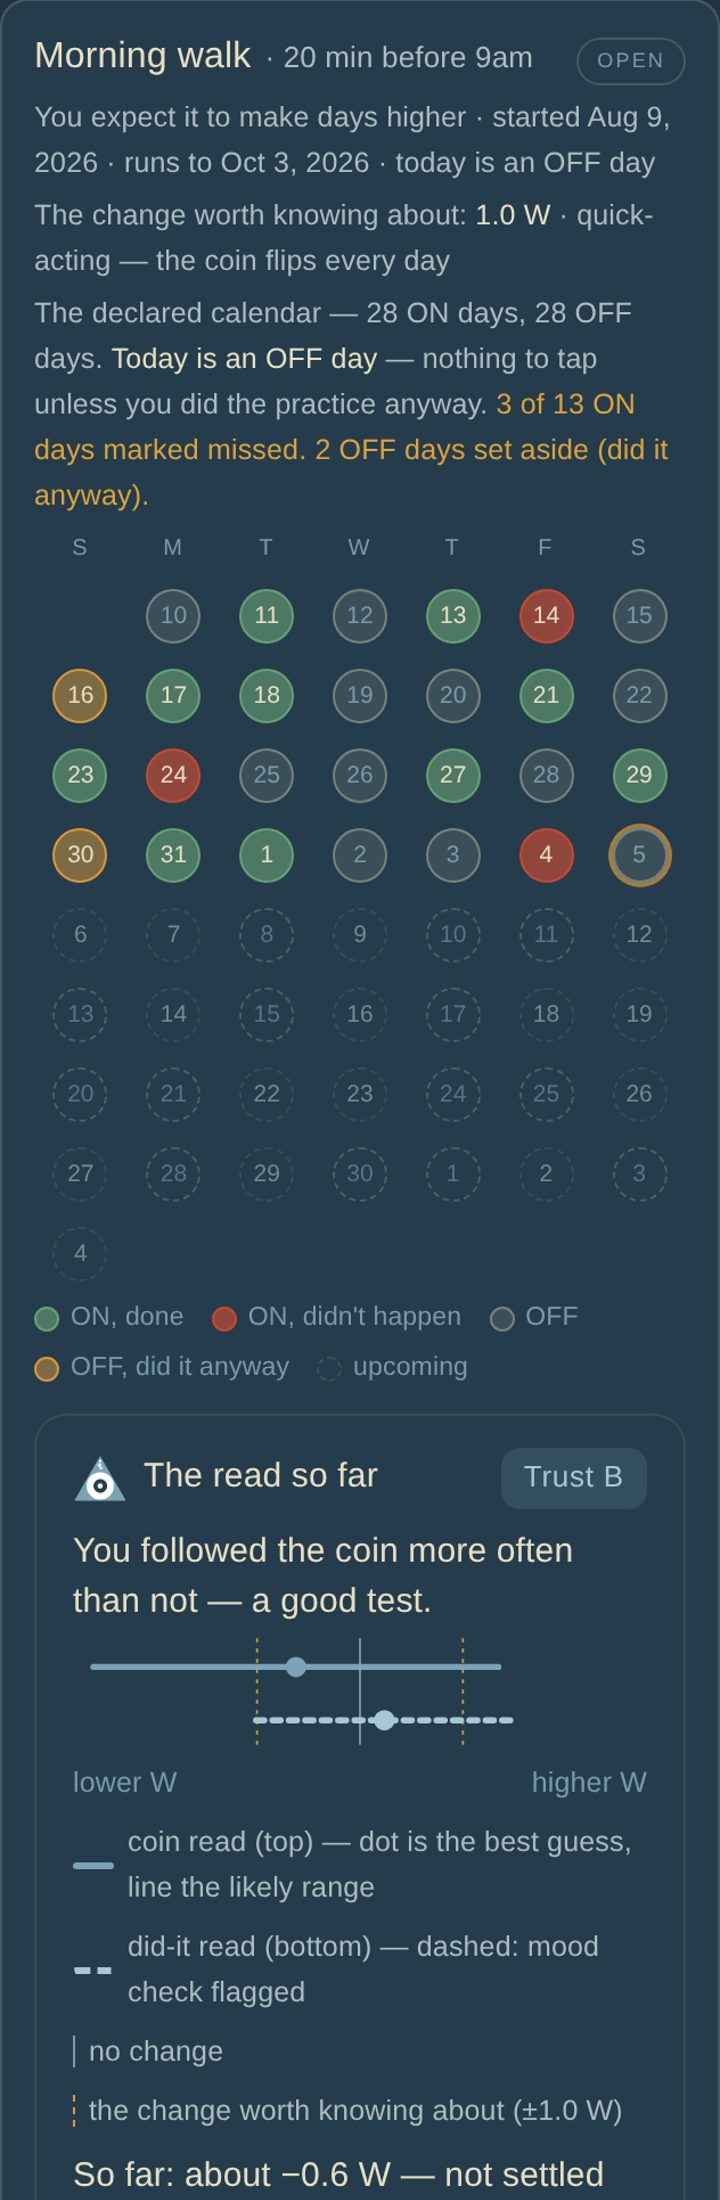
A hunch test is a small, honest experiment on one practice. Name it, give the dose, and say whether it is quick-acting (each day stands on its own — a walk) or slow-building (it builds over a few days — a sleep schedule). The app flips a fair coin for every day ahead of time (every 3 days for slow-building), shows the whole calendar and locks it. 28 days by default; 56 recommended — the setup screen uses your own daily swing to say the smallest change each length can see.
Skipping is expected. Log W as usual; Today shows one line, and you tap it only when an ON day didn't happen or you did it on an OFF day. Each night the app turns W into a surprise (tonight minus what yesterday predicted) and reads the test two ways:
| Coin read | ON days against OFF days, whatever you did. Skipping can't fool it, but every skip waters it down. |
| Did-it read | Days you did it against days you didn't. Sharper — but fooled if you tend to skip on rough days. |
| Mood check | Were the evenings before a skip rougher? If so, the did-it read can't lead. |
| Trust A–D | How well ON and OFF days stayed different, in one plain line. A and B: the coin read leads. C and D: the did-it read may lead as a hint, not proof — only with a clean mood check. |
| Answer meter | Is the test sharp enough yet to see the change you care about? It projects how many more days — or says "heading for no answer, close it now." |
An early clear answer needs a much stronger signal than the end of the test, because looking every night would otherwise fool you. At the close you record your call — survived, falsified, or inconclusive (keep it Still testing). Tests from before v6 keep their declared result and your call, with a "Re-read with v6.0.0" fold beside them. Results on the rest of the bay recompute when your inspection interval comes due (i5.2.10).
Reading the history. Every behavior can be renamed and given a one-line description of what it measured — a rename carries its evidence with it, and renaming onto an existing name asks whether to merge (one all-time study) or keep separate as "#2", never silently. Same-named studies pool, and Detail keeps a by-period breakdown — practice stretches split on 90-day gaps, each judged against its own era — with a periods disagree flag when seasons contradict. The Brief toggles between the lists (curated) and the whole record (unvetted association, confound caveat attached; [Rx] entries print set-aside, never ranked). The archive sorts by certainty, best, worst, most recent, or most days, with a text filter.
It never says "causes." Every verdict reads associated with, in your record. Anything prescribed is a finding for a clinician — never dispositioned here. And if what turns up involves persistent depression, crisis, or harm: 988, by call or text, in the US. The full story: the Repair Bay feature page.
The month, read like a service log.
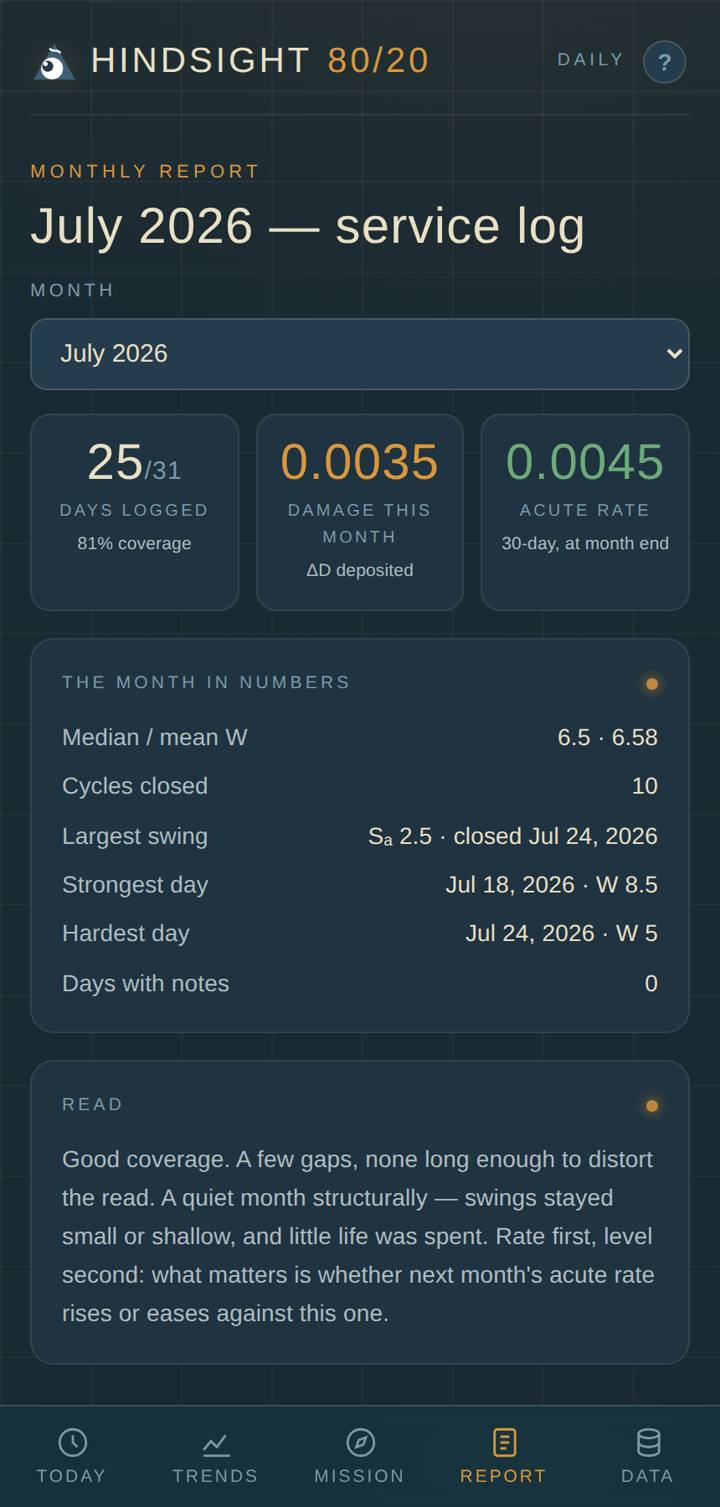
Every calendar month builds its own report: coverage, damage deposited, the acute rate at month end, cycles closed, largest swing, hardest and strongest days, and a plain-language read.
- 1Pick the month from the selector.
- 2Save as PDF opens your phone's print sheet — choose "Save as PDF" and keep or share the file.
- 3Month CSV exports just that month's rows.
The read to carry forward: does next month's acute rate rise or ease against this one?
It lives here. Nowhere else.
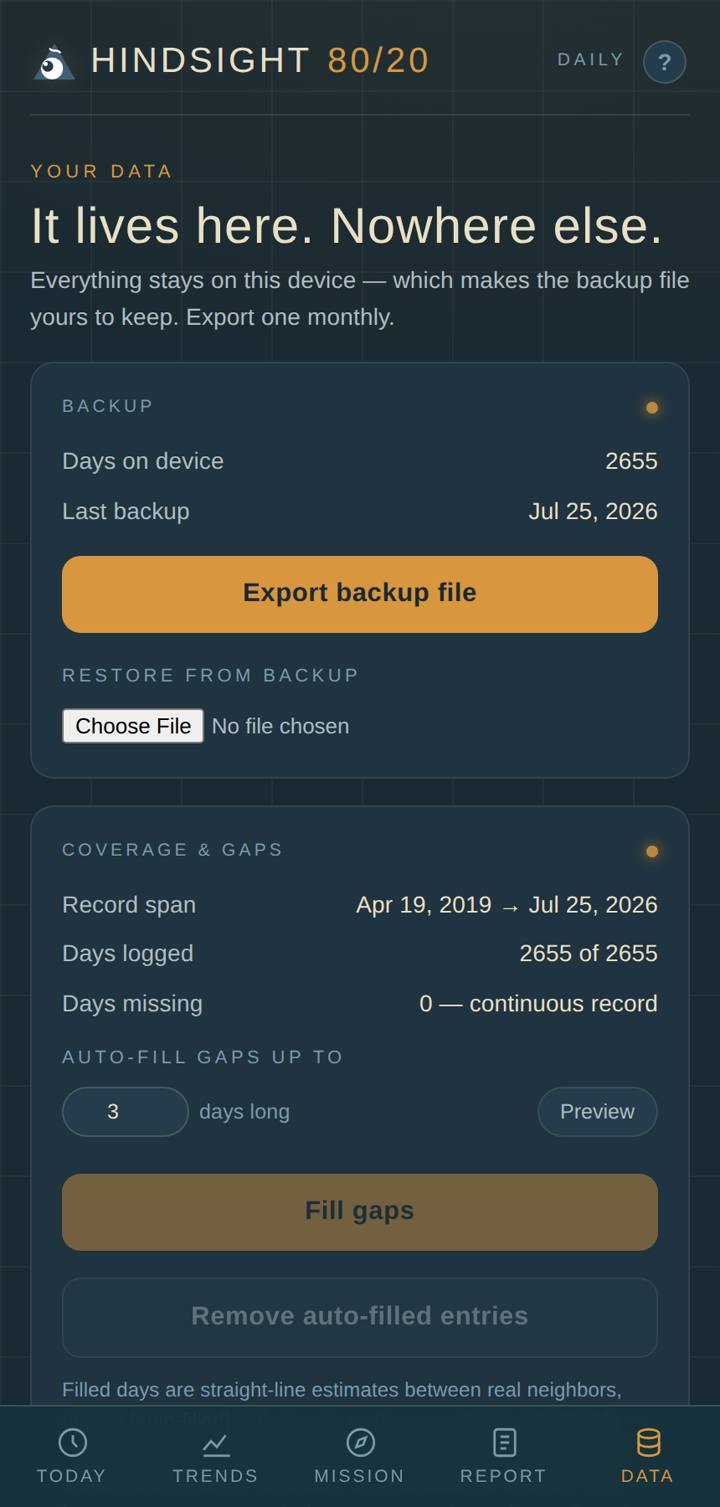
The monthly ritual — one tap. Your record exists only on this device — clearing the browser or losing the phone takes it. Once a month, Export backup file (or Share backup to email or cloud). A banner nags when a backup is missing or stale.
Restore — on a new phone, install the app and feed it the backup file. Everything returns: entries, notes, settings — and since v2.0, missions, daily engagement, the structure parameters — and, since v2.4, the repair log — ride along in the same file. Old backups restore into new versions and vice-versa; unknown keys are simply ignored.
Coverage & Gaps — answers "what am I missing?": span, days logged vs. missing, each gap listed by date range. Fill any day by hand from the Today tab — or auto-fill short gaps with straight-line estimates, each tagged and removable in one tap.
Add past data — import a CSV (date,W,note) or paste rows; days already logged are skipped unless you tick Overwrite.
Advanced — the model parameters, plus one honest button: set your own anchor date and Calibrate pins D = 1.0 to it. Until then, watch the rates.
Fourteen days, on the house.
The first fourteen days are free — the pill in the top corner counts them down. When the trial ends, the instrument locks; your record does not. The lock screen itself carries an export button, because your data is never the hostage.
- 1Unlock Hindsight Daily takes you to secure checkout (Stripe).
- 2After payment you land back in the app and it unlocks itself.
- 3On a second device, or if anything hiccups: enter the email you paid with (or your code) under Purchased before? — it verifies online once, then never needs the network again.
One purchase, yours. No subscription, no account, no tracking.
What this instrument is not.
It is not a diagnosis. D is a gauge of accumulated load, read the way engineers read a wing — it is not a screening score, a clinical judgment, or a prediction. It cannot see a crisis. That includes the pace alert, the alignment map, and the structure view: they compare rates, nothing more.
If you are in one, the right instrument is a person. In the US, call or text 988 — the Suicide & Crisis Lifeline — any time, any reason.
| Privacy | Every entry stays in this browser's storage on this device. Nothing is uploaded, synced, or seen by anyone — including the lab. The unlock check sends only a code or payment ID, never your record. |
| The catch | That privacy is also the risk: the device is the only copy. Hence the monthly backup ritual — the app will nag, and it means well. |
| Decimals | Half-steps are honored everywhere. A 6.5 kind of day is a 6.5. |
| Missed days | Expected. Log what you can; the method was built for irregular records. |
| Missions | Not goals, not scores. A mission is a name for what the spending is for — and "in the hangar" is a legitimate place for an airframe to be. |
| Go deeper | The Application Workbook runs the same pipeline with every formula exposed, and the full story is in Insider Threat, Volume II — "The Spar That Failed." |
Prefer a document?
The same guide, laid out as a 14-page illustrated PDF — it downloads to your device rather than opening here, so you can keep it, print it, or read it anywhere.
↓ Download the PDF guide ▶ Or watch the walkthrough — 3:42